So, You've Collected Your Data. Now What?
From Raw Data to Meaningful Findings: Understanding the Next Step in Your Research Journey.

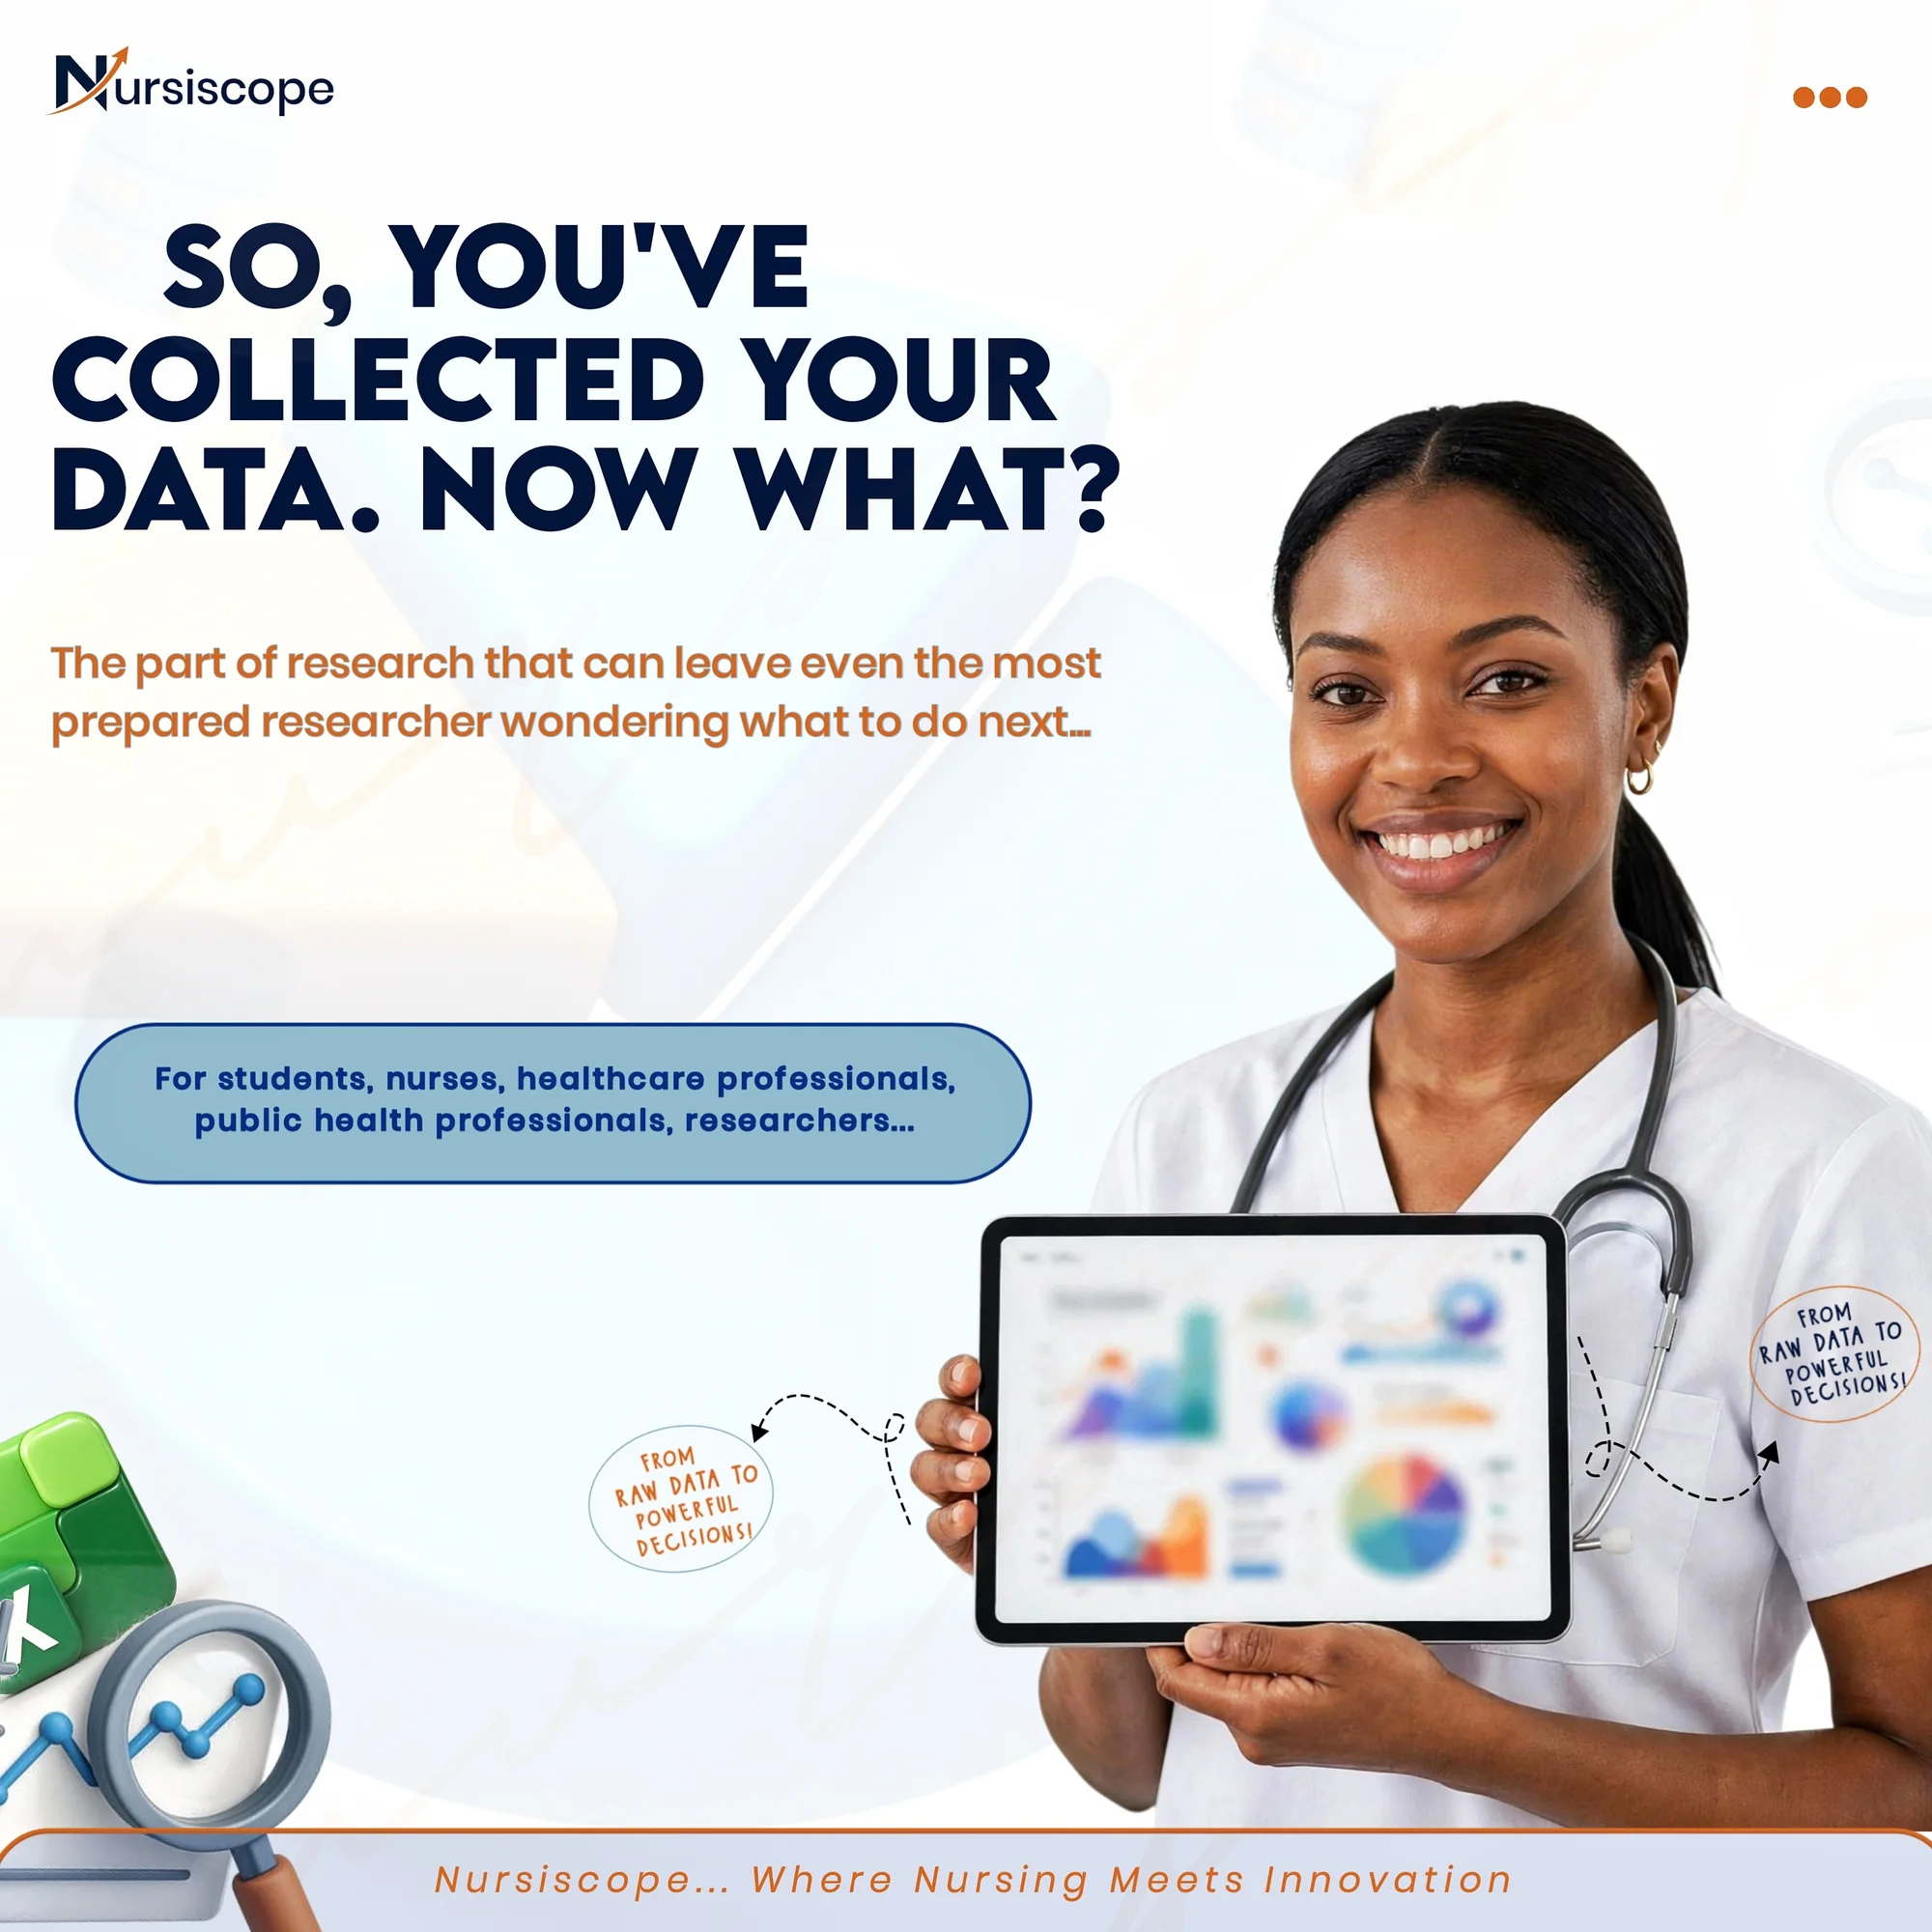
So, You've Collected Your Data. Now What?
The part of research that can leave even the most prepared researcher wondering what to do next.
Everyone talks about how stressful data collection can be.
Getting participants, following up on questionnaires, scheduling interviews, and trying to meet deadlines. Sometimes, just getting people to respond can feel like a research project on its own.
But there's another part of research that doesn't always get the same attention.
What happens when all that data finally lands on your desk?
You've collected your responses, organized your materials, and you're ready to move to the next stage. Then comes the question: What exactly am I supposed to do with all this information?
For some people, this is where the real confusion begins.
Having Data Doesn't Mean You Have Answers
Let's say you're interested in understanding why students struggle academically despite attending lectures regularly.
You gather information from students about their study habits, sleep patterns, access to learning materials, and other factors that may influence their performance.
Now you have the responses.
But what next?
Do you simply calculate percentages and present them in tables? How do you know which information is important? And how can you tell whether the patterns you've noticed actually help answer your research question?
This is where data analysis becomes important.
It's one thing to have information. It's another thing entirely to understand what that information is telling you.
And sometimes, the most interesting finding isn't even what you expected when you started the research.
The Software Isn't Always the Problem
You've probably heard people say things like, "I'll just use SPSS for my analysis" or "I'll find someone who knows how to use the software."
That's understandable. Not everyone feels confident working with data, particularly when statistical software is involved.
But here's something worth thinking about.
Knowing how to use a software application is not quite the same as knowing how to analyze data.
You might know how to generate a table or chart without fully understanding what it means. You might also have the right software but still be unsure about the best way to approach your research question.
Think of it like owning a calculator. Having one doesn't automatically mean you know which calculation to perform or why.
The same applies to data analysis.
Excel, SPSS, R, NVivo, and Power BI are useful tools, but the real value comes from understanding how to use them appropriately and make sense of the results.
You Should Be Able to Explain Your Own Findings
Imagine presenting your research findings and being asked a simple question:
"So, what does this result actually mean?"
You know the numbers are correct because someone helped you run the analysis. You have the tables and charts in your report.
But explaining the findings becomes difficult.
This can happen when we focus more on getting our analysis completed than understanding the process behind it.
There's nothing wrong with asking for help. Researchers collaborate with statisticians, data analysts, and other specialists all the time.
However, understanding your own findings is important.
You should be able to explain what you discovered, how the findings relate to your research questions, and what conclusions can reasonably be drawn from them.
After all, the goal of research isn't simply to produce results. It's to contribute something meaningful through those results.
So, Where Do You Start?
The good news is that learning data analysis doesn't mean you have to understand every statistical method or master several software applications overnight.
You can start with the basics.
Learn how to organize your information properly. Understand the difference between the kinds of data you collect. Become familiar with how to summarize your findings and how to select appropriate approaches to answering your research questions.
Then, gradually learn the tools that support these activities.
More importantly, practice.
Reading about data analysis is helpful, but working with actual datasets, making mistakes, asking questions, and learning how to correct them can make a significant difference.
And you don't have to figure everything out on your own.
Having people you can learn from, ask questions, and exchange ideas with can make the process less intimidating.
Learning to Make Sense of Data with Nursiscope
At Nursiscope, we recognize that developing practical research skills takes more than learning concepts in theory.
That's why we're introducing the Nursiscope Data Analysis Hub, a four-month virtual training program beginning in December 2026.
The program is designed for students, nurses, healthcare professionals, researchers, and public health professionals who want to strengthen their practical data analysis skills.
Participants will explore quantitative and qualitative data analysis, data cleaning and management, interpretation, visualization, and the responsible use of AI-assisted tools.
The training will also introduce practical applications of Excel, SPSS, R/RStudio, NVivo, and Power BI, with opportunities to learn from facilitators experienced in these areas.
Beyond the classes, the hub aims to create a community where participants can ask questions, share knowledge, support one another, and build professional connections.
Whether you're working on a research project, preparing for postgraduate studies, or simply interested in becoming more confident with data, this could be an opportunity to develop skills you can continue building on.
Ready to Take the Next Step?
Registration for the Nursiscope Data Analysis Hub is open.
Register for the Data Analysis Hub: https://tr.ee/Nursiscope-Hub
Collecting your data is an achievement. Understanding what to do with it is how you begin turning that effort into meaningful findings.
Nursiscope
Where Nursing Meets Innovation